Denis Mutiibwa
United States Department of Agriculture - ARS
Beltsville, Maryland
LATEST PROJECTS
HEAT WAVES
&
COLD WAVES
HEAT AND COLD WAVES
This research modeled recent and future heat- and cold- wave events across the Contermious United States (CONUS). A heat wave was defined as an event with six or more consecutive days with maximum temperatures above the 90th percentile. A cold waves was defined as an event with six or more consecutive days with minimum temperatures below the 10th percentile. The figures show the distribution of the total number of these events the ocurred across CONUS in selected extreme years.


TEMPERATURE EXTREMES
DAILY HOT AND COLD EXTREMES
This project used the World Meteorological Organization ETCCDI Climdex method to determine the number of daytime and nighttime hot and cold extremes. The period of 1981-2010 was used as the base period and was bootstrapped to remove inhomogeneity in the time series. The figures show the number of extreme warm days, cold days, warm nights and cold nights across the United States for selected extreme years; 1993 (cool), 2011 (hot) and 2012 (hot) .
(Published in: Journal of Geophysical Research Atm.
DOI: 10.1002/2015JD023598)


TRENDS IN RECENT EXTREME WARM AND COLD DAYS AND NIGHTS
Trends in extreme warm days, cold days, warm nights and cold nights were determined based on Kendall Tau trend method for the period of 1980 - 2012. These trends were computed on annual and seasonal basis. In the figures are trend estimates with hatching showing areas where the number of extreme warm and cold days and nights were significantly increasing (red) or decreasing (blue). Also included in the figures are trends in maximum (TMAX) and minimum (TMAX) temperatures over the same timeframe.
(Published in: Journal of Geophysical Research Atm.
DOI: 10.1002/2015JD023598)
TRENDS IN
TEMPERATURE
EXTREMES


As an example, figure 1 maps the spatial distribution of number of hours to lethal dehydration on an extremely hot day (Aug/08/2012) and on projected hot summer day in 2100. Figure 2, shows the current (average: 1980-2012) and future (2100) number of days with conditions reaching lethal dehydration in a range of hours. The maps in the figures show the Cactus Wren (Campylorhynchus brunneicapillus) habitat range in the Southwest part of the United States
EXTREME HOT TEMPERATURES AND
DESERT BIRDS
MAPPING DURATION TO LETHAL DEHYDRATION IN THE U.S. SOUTHWEST DESERT BIRD COMMUNITIES
Extreme hot temperatures have a variety of direct and indirect effects on animals. Over the recent decades these events have become more frequent, intense, and widespread across the United States. In the southwest, the hottest and driest United States region, desert bird communities are facing dire increasing thermal stresses and water stresses. Using field experiments in the region, measurements of changes in evaporative water loss as temperatures increased on extremely hot summer days were used to develop models and map the duration to lethal dehydration in desert birds. Based on IPCC Emission scenario (A1F1), the study also mapped future conditions to lethal dehydration in a warmer climate.


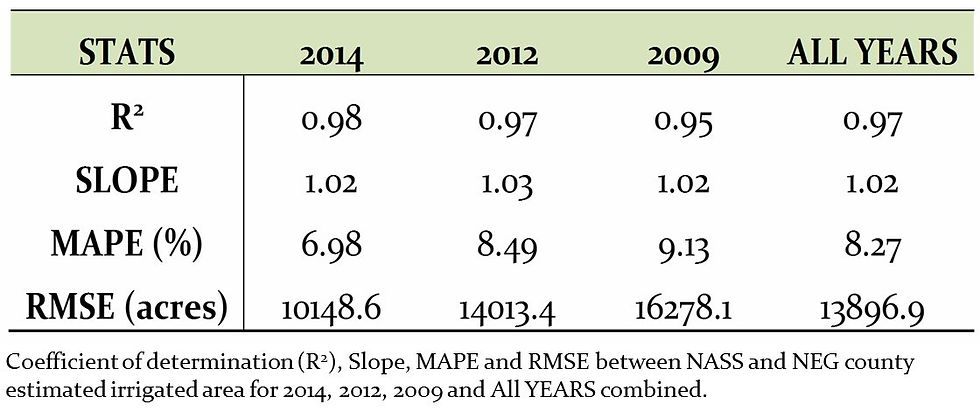
This project developed an irrigation classification scheme that integrates surface energy balance modeling and vegetation indices to classify irrigated and non-irrigated croplands at fine spatial resolution. The scheme which is reliable in dry, normal, and wet growing seasons without re-calibration. With ancillary techniques to gap-fill missing data due to clouds and instrumentation failure the scheme is designed to map and monitor irrigated croplands with complete spatial coverage from field- to continental-scale.
LAND USE
CLASSIFICATION
A SURFACE ENERGY BALANCE AND VEGETATION INDEX APPLICATION TO MAP AND MONITOR IRRIGATION IN NEBRASKA
Reliable statistics on the amount and spatial distribution of water consumption from field to regional scale are regarded as the starting point for efficient and sustainable management of water resources. Manual survey of irrigation status in large irrigation districts, counties and regions is a time- and labor-intensive campaign. An efficient and reliable method for classifying and mapping irrigation status of croplands is indispensable to water resources-related governance, decision making and modeling.events the ocurred across CONUS in selected extreme years.


MAPPING
SURFACE
ENERGY
BALANCE
COMPONENTS
MAPPING SURFACE ENERGY BALANCE FLUXES IN SOUTH CENTRAL NEBRASKA
Using satellite imagery and meteorological data, surface energy balance algorithms have become important tools which provide indispensable hydro-information on spatial trends and distribution of surface energy fluxes from field to regional scales. The Surface Energy Balance System (SEBS) algorithm (Su, 2002) was used to estimate surface energy fluxes in sub-humid and semi-arid climate of south central Nebraska using Landsat imagery and meteorological data. The figures show estimated surface albedo, NDVI, LAI, Net Radiation, Surface temperature, Soil heat flux, Sensible heat flux, and Latent heat flux (Actual Evapotranspiration).